As-Laid Pipeline Survey with Side Scan Sonar: Procedure and Lessons
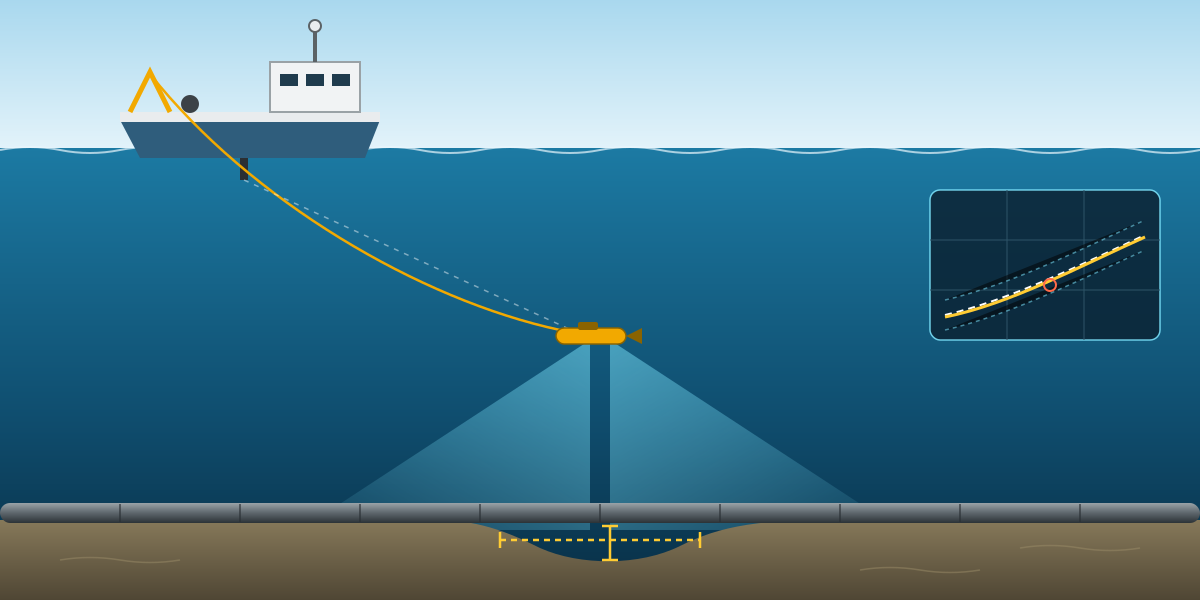
Once a pipeline is on the seabed, the first question is simple: is it where it should be, and is it properly supported? The as-laid survey answers that. It is done soon after lay, before trenching, rock dump or hydrotest, while there is still time to fix free spans cheaply.
This article is based on an as-laid survey procedure for a long 28-inch offshore gas pipeline, surveyed from a small vessel with side scan sonar as the main tool. The procedure was prepared by the project engineer; I reviewed it and gave review comments before it was finalised. It explains how the survey is set up, how the vessel is calibrated, how the survey lines are designed and what happens with the free spans that are found. Client, project, vessel and location details are left out.
What the as-laid survey covers
The scope in the procedure was:
- Pipeline as-laid position and alignment.
- Bathymetry along and next to the route, from a single beam echosounder.
- Side scan sonar coverage to confirm the pipe position and find free spans.
- Free span location, length and height.
- Crossings with existing pipelines and cables, including the support and protection at each crossing.
- Positions of barred tees, flanges and mattresses.
ROV inspection, multibeam, as-built and cathodic protection surveys were done by others and were not part of this scope.
The accuracy targets were clear: pipeline position better than ±1 m, and free span length and height to ±0.1 m.
The spread
The survey vessel was a mid-sized anchor handling tug, fitted with:
- DGNSS with a high-accuracy correction service, plus a survey gyrocompass for heading and a motion sensor.
- EIVA NaviPac for online navigation and NaviScan for acquisition, with an offline system for processing.
- A Sonardyne USBL system with spare beacons, to track the towfish.
- An EdgeTech dual-frequency side scan sonar on a winch and armoured tow cable.
- A single beam echosounder.
- A CTD and sound velocity profiler.
- Helmsman displays on the bridge, for the client representative and for the field engineer.
- SonarWiz for side scan processing, and tide prediction software.
- A total station, tapes and prisms for offsets and checks.
Each critical item had a spare. On a long pipeline, losing a day to a broken sensor is expensive.
Geodesy and datum
The project used WGS84 on a UTM grid. Depths were reduced to Lowest Astronomical Tide (LAT), with predicted tides calculated at 10-minute intervals from the nearest tide station. As always, the transformation is tested in the navigation software against a known point before any data is logged.
Calibration before the survey
The procedure spent more pages on calibration than on the survey itself, which is the right balance. Most of the errors in an as-laid survey come from setup, not from the sonar.
Local control. If there is no good control on the quay, a control point is established with static GNSS observations. It should be solid, stable, clear of obstructions and not in the way of quay operations.
Offsets. Every sensor and point of interest is measured from the GNSS antenna reference point with a total station, then checked independently. The values go into a vessel offset form and into NaviPac.
DGNSS verification alongside. With all offsets in NaviPac set to zero, a total station on a known control point observes the antenna directly, at least ten readings at intervals of 10 seconds or more, while the DGNSS logs at one second. The acceptance criteria were:
- Mean difference between total station and DGNSS no more than 0.6 m.
- Standard deviation less than 0.2 m.
- At least five satellites, correction age under 20 seconds, and PDOP below 5 during the check.
DGNSS verification offshore. If an alongside check is not possible, the vessel can verify its position in the field by logging the moment the antenna lines up with two legs of a platform jacket, several times from different directions. The intersections give the leg positions, and from them the platform centre, which is compared with its known coordinates. A radial difference of more than 7 m, or a large spread in the results, means something is wrong.
Gyro calibration. Alongside, the gyro is calibrated with a total station against two control points on the quay, at least ten readings, with grid convergence applied if the quay bearing is on grid. If the vessel cannot come alongside, the procedure uses sun azimuth observations:
- Observe with a theodolite and a Roelof's prism, at a sun elevation of about 30°. Never look at the sun without a proper filter.
- Do not use a total station for sun shots; the sun can damage its electronics.
- Measure the angle between the vessel centre line and the sun, apply it to the computed sun azimuth at the exact UTC time, and compare with the gyro.
- Take at least two sets of observations, and correct for the sun's semi-diameter if only one limb is observed.
A third option is to come alongside a barge with a known heading, measure the distances from the barge to the vessel's bow and stern, and compute the vessel heading from that.
Integrity test. This is the final check that ties everything together. NaviPac computes the position of a point on the vessel, such as the centre of the stern, from the antenna position, the corrected heading and the offsets. A total station on a known benchmark measures the same point at least five times, at synchronised times. If the mean difference and standard deviation are within tolerance, the whole positioning chain is proven. If not, one of the three inputs is wrong.
Sound velocity and USBL. A CTD and sound velocity profile is taken in the survey area and applied to the navigation and USBL systems. The USBL is then calibrated in the field with a four-quadrant box-in: a transponder on a seabed frame, the vessel holding the same heading at four positions around it, and at least 200 fixes per position at one-second interrogation. After removing outliers, the software computes the transducer pitch, roll and heading corrections, which are always applied.
Running the survey
The preliminary pipeline alignment comes from the touchdown points recorded on the lay barge. The survey confirms the real position.
The side scan was set up as follows:
- 540 kHz, the high frequency, for the best resolution on the pipe.
- Maximum range 50 m per channel.
- Towed about 10 m above the seabed.
- Survey speed 3 to 4 knots.
- Towfish positioned by USBL.
- Fix marks every 100 m, with fix number, time and towfish position on the record.
Line spacing was designed to give at least 50% overlap between adjacent lines, and the procedure showed the calculation, which is a good habit:
- Overlap = total swath − line spacing.
- Overlap (%) = overlap ÷ total swath × 100.
- For 50% overlap, the line spacing can be at most half of the total swath.
The total swath has to come from the range actually set on the sonar. With 50 m per channel, the swath is about 100 m, so 50% overlap needs lines no more than about 50 m apart. It is worth checking this arithmetic in every procedure, because a range changed on deck changes the overlap too.
Two parallel lines either side of the pipe means every part of the pipe is seen from both sides, which helps to separate a real free span from an acoustic shadow.
A real-time coverage map was used to confirm the seabed was fully covered while the vessel was still on site. The sound velocity about 10 m above the seabed was applied to the side scan where needed.
Crossings
At each crossing with an existing pipeline or cable, side scan shows the crossing position, the support and any mattresses or other protection. The single beam profile adds the change in seabed level at the crossing. Together, the shadow in the sonar image and the depth profile confirm where the crossing is and give an approximate clearance.
Where an anchored vessel's mooring lines cross an existing pipeline or cable, pre-anchor and post-anchor surveys are required to show the condition of the existing line before and after.
Free spans and their correction
Every free span is reported with location, length and height. The allowable span length is not one number: it depends on the pipe wall thickness, the concrete coating, water depth and the load case. The project's free span analysis gave allowable lengths for each pipeline section and for each phase:
- Installation (empty pipe).
- Flooded.
- Hydrotest.
- Operation.
For most sections, the operation case was the most restrictive, roughly 24 to 39 m, while the installation case allowed much longer spans. A span that is acceptable today may not be acceptable once the pipe is full of gas and running for years.
Spans that exceed the allowable length are reported to the client, corrected by adding support under the pipe, and then surveyed again to prove the correction worked.
Weather limits
The survey was limited to a significant wave height of 2.0 m and wind of 25 knots, with the final decision left to the vessel master and the site team. A towed sonar in rough sea gives poor data, and recovering it in bad weather is a safety risk.
Reporting
- A mobilisation report with the control, heading calibration, offsets, integrity test and USBL calibration.
- A survey log kept by the online surveyor.
- A daily progress report signed by the contractor representative.
- Field reports and charts for each task.
- A final report within two weeks of the survey, documenting methods, equipment, accuracy and resolution, processing, results and deliverables.
What I took from it
- The sonar is the easy part. The positioning chain behind it, from control point to offsets to heading to USBL, decides whether the pipe position is right.
- Write down the acceptance criteria. Numbers such as 0.6 m, 0.2 m and 7 m make a verification pass or fail, not "looks OK".
- Show the coverage calculation. Line spacing and overlap should be in the procedure, not decided on deck.
- Know which load case matters for free spans. Report spans against the right allowable length, and say which case it is.
- Keep an offshore option for every calibration. Not every vessel can come alongside, so the procedure should already say how to check position and heading at sea.