ROV As-Built Survey of a Rigid Gas Pipeline: Method and Findings
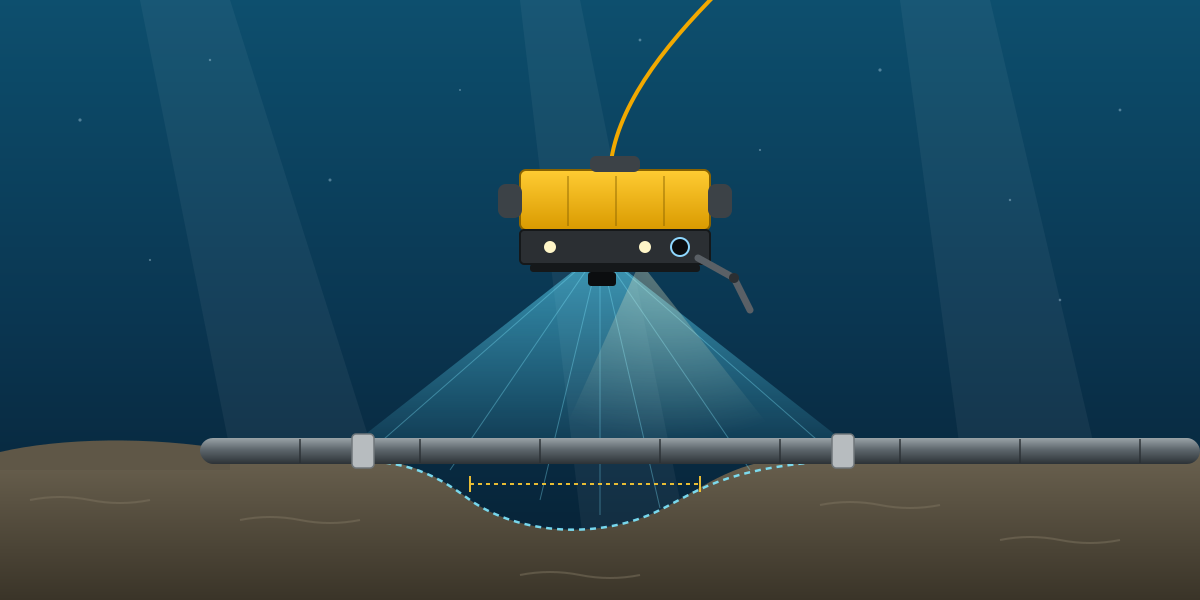
An as-built survey is the last word on a pipeline installation. Once it is accepted, it becomes the baseline that every future inspection is compared against. If the as-built is weak, every survey after it is harder to interpret.
I was involved in an ROV as-built survey of a newly installed 18-inch rigid gas pipeline, about 13.5 km long, in 80 to 100 m of water, on an offshore gas development. This article explains how the survey was set up, how the multibeam was calibrated, what the inspection found, and what made the data trustworthy. Client, field and location details are left out on purpose.
What an as-built survey has to answer
The pipeline had been laid empty and flooded for hydrotest, with blind flanges at both ends. The as-built survey had to confirm:
- Where the pipeline actually is, compared with the design route.
- Whether it was damaged, buckled or dragged during installation.
- Where it spans free over the seabed, and whether any span is longer than the design allows.
- Where it is buried, and how much.
- The condition of the anodes, field joints and end flanges, and whether the cathodic protection is working.
- Any debris on or near the pipe.
The spread
The survey ran from a construction vessel with two work-class ROVs. The main tools were:
- Surface positioning: dual DGNSS with high-accuracy correction and QC, two gyros and motion sensors.
- Subsea positioning: a USBL system (Kongsberg HiPAP) as primary, with a second USBL as backup.
- ROV navigation: an INS (Octans) aided by a DVL (Teledyne RDI Workhorse) and a pressure sensor for depth.
- Multibeam: an R2Sonic 2024 mounted on the ROV.
- Cameras: a main camera plus boom cameras to see the sides and underside of the pipe, recorded to digital video with on-screen data overlay.
- Cathodic protection: a twin-cell CP probe for contact and field gradient readings.
- Software: EIVA NaviPac for navigation, NaviScan for acquisition and NaviModel for processing, with a separate video eventing system.
Sound velocity
The multibeam is only as good as the sound velocity applied to it. A profile was taken with a Valeport Midas SVX2 down to the seabed. Surface velocity was about 1,543 m/s and seabed velocity about 1,537 m/s. The profile was nearly constant in the top 45 m and then dropped by around 5 m/s in the deeper water. That type of gradient is exactly what bends outer beams if it is ignored.
Multibeam calibration
Before the main survey, a patch test was run over the pipeline itself at about 80 m water depth. A pipe on a flat seabed is a good calibration target: it is straight, well-defined and easy to cut across in profile.
Five lines of 75 m were run:
- Latency: two lines in the same direction at different speeds (0.5 and 1 knot).
- Pitch: two lines in opposite directions over a seabed feature.
- Roll: two lines in opposite directions over a flat area.
- Yaw (heading): two parallel offset lines in the same direction over a well-defined feature.
The lines were processed in NaviModel by taking cross-section slices and adjusting each angle until the surfaces lined up. The results were:
- Latency: 0.000 s
- Pitch: -1.50°
- Roll: 0.98°
- Heading: 7.10°
After applying the corrections, the remaining differences between line pairs were about 1 to 2 cm for pitch, roll and heading. A heading offset of 7° may look large, but on an ROV-mounted head it is not unusual. That is why the calibration has to be done on every mobilisation and not copied from the last job.
The multibeam ran at 400 kHz with a 120° swath and about 10 m coverage either side of the pipe. The resulting DTM was much more detailed than the 1 m grid required by the specification, which made spans and burial very clear.
Running the survey
The ROV started at the flange at the far end of the line and flew back along the pipe to the flange at the platform end, in descending KP. The pipe was tracked continuously, with eventing done live by the online data processor. Every event was logged with KP, position and depth: free span start and end, burial start and end, anodes, field joints, features and debris.
The vertical datum was mean sea level, using predicted tides from the nearest tide station. Time was logged in local time, with all systems synchronised to the navigation clock.
What the survey found
The headline result: no damage, no buckle and no sign of movement. There were no drag marks on the seabed, and the cross-course offset of the pipe from the design route was within 2 m along the whole line.
Free spans. 101 free spans were recorded. Most were short: 67 were under 20 m. The longest was 41 m, and it was the only anomalous span, because the allowable span length for that section of the pipeline was about 40.2 m. The highest span was 2.5 m above the seabed, over a local depression, but it was only 27 m long and within the length criterion. Each span was checked against the multibeam profile, not just the video, so both length and height come from measured seabed surfaces.
Burial. 61 sections of full burial were logged, 658 m in total. None were anomalous. Burial was again confirmed against the multibeam data.
Field joints. 911 field joints were seen and logged with position. All were in good condition, with no damage and no loose wrapping. The remaining joints were not visible because they were buried.
Anodes and cathodic protection. 99 half-shell bracelet anodes were seen, all less than 25% depleted and none anomalous. Three more were not visible because of burial. Most anodes already showed light deposits, which indicates they were active. CP readings were taken on every anode within the first and last 500 m of the pipeline, and on at least one anode per kilometre in between. At the end flanges, readings were between -1,056 and -1,077 mV, well inside the protected range. The conclusion was that the pipeline is adequately protected and no remedial work is needed.
Features. The two hydrotest blind flanges were in good condition, with all plug valves closed and no damage to the fittings.
Debris. 16 debris items were recorded, mainly wooden poles, scaffolding and tree branches. None were metallic, none were in contact with the pipe in a way that caused damage, and none were classed as anomalous.
Making the data trustworthy
Most of the value in an as-built is not in the video. It is in tying the video and the multibeam together:
- Every span and burial event from the video was cross-checked against the multibeam long profile, using the top of pipe, bottom of pipe and mean seabed on either side.
- Field joint positions were fixed throughout, which gives a reliable chainage reference for future inspections.
- All video, eventing and multibeam data went through a QA/QC step before the report was issued.
This matters because video alone is subjective. Visibility, camera angle and ROV altitude all change what a span "looks like". A measured profile does not.
What I took from this job
- Calibrate on the target you are going to survey. Using the pipe itself for the patch test gave clean, defensible angles.
- Small numbers matter. One span was over the limit by less than a metre. The decision about whether it needs intervention belongs to the pipeline engineers, but they can only make it if the survey measures it properly.
- Log everything with position. Anodes, field joints and debris with fixed positions turn the as-built into a real baseline, not just a pass or fail.
- Combine sensors. Video, multibeam and CP each tell part of the story. The report is strong when they agree, and the places where they disagree are where you look harder.
- Keep the summary short. The client needs to know: is the pipe where it should be, is it damaged, is it protected, and what, if anything, needs attention. Everything else is supporting data.