Seabed Survey for a Subsea Power Cable Route: Pabelokan to NORA-A
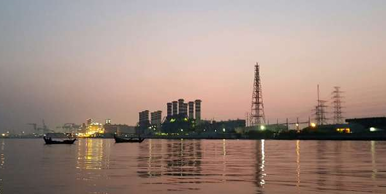
I joined a small survey team on a seabed survey for the replacement of a 15 kV 500 MCM subsea power cable in the Offshore South East Sumatra (OSES) block. The old cable ran from the power plant on Pabelokan Island, in the Kepulauan Seribu area north of Jakarta, to the NORA-A platform about 9.6 km away. Before a new cable could be laid, the client needed to know what was on and under the seabed along the planned route, and where the lay barge could safely put its anchors.
PT Explora Prima did the survey as a subcontractor to PT Cakrawala Amartha Jaya, for PT Voksel Electric and PHE OSES. My role was land surveyor. This is a summary of how the job was set up, what we found, and what I took from it.
Why survey a route that already has a cable?
It is tempting to think that a replacement route is "known ground". It is not. The area around Pabelokan is one of the busiest pieces of seabed in the block: power cables to several platforms, oil and gas pipelines, a jetty, old rig sites and years of anchoring. Drawings show what was planned, not always what was built, and the seabed changes.
The survey had two jobs:
- Confirm the seabed conditions along the proposed cable route and flag anything that could affect cable lay.
- Map existing structures and hazards across a wider corridor, so the barge anchor pattern could be designed without dropping an anchor onto a live pipeline or cable.
Survey design
The survey corridor was 1 km wide and 9.8 km long. We ran thirteen main lines along the corridor at 100 m spacing, plus ten cross lines at 1,000 m spacing to check the main line data.
Near the island, where water gets shallow and the structures crowd together, we added six nearshore lines at 20 m spacing. Around NORA-A we ran twelve extra lines to cover the platform approach, and six more lines over existing pipelines and cables near Pabelokan. In total the team logged about 206 line-km in eight days, including mobilisation from Ancol, Jakarta, and transit.
The vessel was GVH Elmira, a small survey boat. Small boats are the right tool for shallow, congested water, but they come with limits: little deck space, more motion, and not much room for error when you are running lines close to a platform or a reef.
Equipment
All three seabed sensors were run at the same time on every line:
- Single beam echosounder (Odom Echotrac MkIII, 200/33 kHz) for water depth.
- Side scan sonar (C-Max CM2, 150 m range per channel) for seabed features and existing structures. It was pole-mounted in the nearshore area and towed on a 30-50 m cable offshore.
- Sub-bottom profiler (SyQwest Bathy2010 chirp, 3.5 kHz) for the shallow geology under the seabed.
Positioning and heading came from a Trimble SPS461 dual-antenna receiver with MarineStar correction, and QPS Qinsy 8.18 handled navigation, data logging and the helmsman display. On land, we used GNSS receivers and a total station for control points and checks.
Geodesy and vertical datum
The client works in Batavia (Bessel 1841) on a Transverse Mercator projection with the central meridian at 108° E. Before logging any data, we tested the datum transformation in Qinsy against a known point: WGS84 in, Batavia grid out, and compared with the expected values. This takes ten minutes and prevents the worst type of survey error, the one that is consistent and therefore looks correct.
Depths were reduced to Chart Datum (0.6 m below mean sea level) using predicted tides for Tanjung Priok from the Pushidros tide tables. The echosounder was calibrated with bar checks before and after survey operations, with the transducer draft set at 1.2 m.
What the data showed
Bathymetry. The proposed route is 9.619 km long. Water depth along the route ranges from 11.9 m to 36.9 m below Chart Datum, with an average of 32.3 m. For most of the route the seabed is almost flat, with slopes under 1°. The exception is the last 60 m or so before the island, where the seabed rises steeply onto the reef edge, with local slopes up to about 33°. That short section matters more for cable protection and landing design than the other nine kilometres.
Seabed type. Side scan shows mostly low to medium reflectivity seabed, interpreted as soft to firm silty sand, with a sand veneer in places. Near the island there is coral, which shows up clearly as rough, high-reflectivity texture in the sonar and as an irregular, hard reflector in the sub-bottom data.
Existing structures. Inside the corridor we confirmed eight pipelines and seventeen subsea cables, as well as the north jetty, sleepers, pipe supports, a mattress and the platform itself. The proposed route crosses four of them: three pipelines (20", 12" and 18") and one 35 kV power cable. Two findings are worth mentioning:
- A fibre-optic cable route that appeared on the client drawings was not found anywhere in the data. Most likely it had never been installed.
- Two pipelines near Pabelokan did not match anything on the drawings. They are not continuous and are probably old drain or suction lines.
One existing pipeline also had a free span after it passed under the jetty, with supports visible in the sonar data.
Debris and seabed features. Nine linear debris items, between 3 m and 12 m long, were picked from the side scan. The closest was about 65 m from the route. We also mapped a pockmark cluster (a sign of shallow gas that has escaped through the seabed) about 230 m from the route, old spudcan footprints from a jack-up rig about 215 m away, a few high-reflectivity patches, and seabed scars from anchoring and fishing. The route does cross one area of disturbed seabed, a shallow depression, but this is not a hazard for cable lay.
Shallow geology. The sub-bottom profiler reached up to 43 m below the seabed. Without cores or boreholes the interpretation is qualitative, using an assumed sediment velocity of 1,600 m/s. Three units were identified:
- Unit A: soft to firm silty sand at the top, present across the area.
- Unit B: firm to stiff sand, coarser than Unit A, coming up to the seabed in places.
- Unit C: the hardest reflector, interpreted as bedrock, below which the signal is lost.
Soft sediment along the route is 4.7 m thick on average, with a maximum of 16.7 m near the NORA-A end. This is useful input for deciding whether the new cable can be buried or will need other protection.
Conclusion of the survey: no significant seabed or sub-seabed hazard was found along the proposed route. The main design issues are the four crossings and the steep, coral-covered shore approach at Pabelokan.
The route changed after the first report
The first version of the report was issued for review. After the client reviewed the results, the proposed route was revised, and the route-specific results (profiles, crossings, features along the route) were recalculated for Rev 0. Because we had surveyed the full 1 km corridor and not just a narrow strip along the first route, this did not require a return to the field. A wide corridor costs more on day one, but it makes the data useful for longer.
What I took from this job
- Treat client drawings as a starting point, not as truth. On this survey one "existing" cable did not exist, and two real pipelines were not on the drawings. On a lay or anchoring job, either type of error can be expensive.
- Run the sensors together and interpret them together. A feature that is unclear in the side scan is often obvious in the sub-bottom profile, and the other way around. Coral, pipelines and pockmarks were all confirmed by more than one sensor.
- Check the geodesy before the first line. A transformation test in the navigation software is quick. A datum error found after demobilisation is not.
- Keep the report focused on the decision. The client needed to know: is the route clear, where are the crossings, and where must the anchors stay away from. Everything else supports those answers.
- Safety is part of the result. We held daily toolbox talks, checked the survey poles, davit and safety wires every day, and finished with no HSE incidents. On a small boat working close to platforms, that does not happen by luck.
Subsea cable routes in mature fields like OSES will keep needing replacement as old infrastructure reaches the end of its life. The surveys behind them are not glamorous, but they are where a lot of avoidable risk is removed before the barge arrives.