Tides, Metocean and Monitoring: The Analysis Side of a Survey Package
Most of a survey package happens on a boat or in the field. A smaller part happens at a desk: turning months of tide readings into predictions, turning wind and current records into design numbers, and turning repeated measurements of a platform into a statement about whether it is moving. These services are easy to overlook in a scope of work, because they have short equipment lists. They are also where some of the most senior people in the package end up working.
This is the fourth and last article in a series based on a project execution plan I prepared for a topography and positioning services package. The earlier articles covered the plan as a whole, geodetic control, and hydrographic and pipeline surveys. This one covers the remaining family: tide observation, data analysis, on-call services and temporary markers. Client, project, field and location details are left out.
What is in this family
The plan listed these service lines:
- Tide observation.
- On-call services for survey equipment and personnel.
- Data analysis A: tide analysis and prediction.
- Data analysis B: metocean analysis.
- Data analysis C: platform settlement and deformation monitoring.
- Data analysis D: setting temporary markers.
They look like a mixed bag. What links them is that they produce information other people use to make decisions, rather than a survey chart of their own.
Tide observation
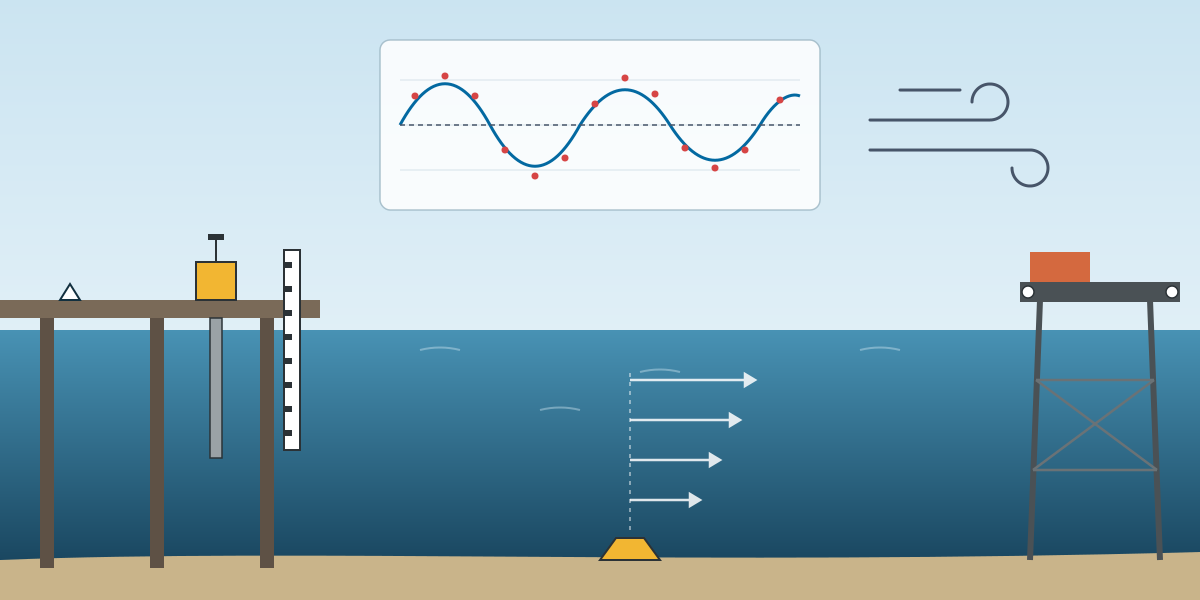
Every near-shore service in the plan included an automatic shore tide gauge, and tide observation was also listed as a service of its own. The difference matters. A gauge that runs only while a boat is surveying gives corrections for that survey. A gauge that runs for weeks or months gives a record that can be analysed.
The basics of a good tide observation are simple and often skipped:
- A stable mounting, on a structure that does not move with the tide or the wind.
- A gauge zero tied by levelling to the project bench marks, checked at the start, at intervals and at the end.
- Regular manual readings against a tide staff, to catch drift or a blocked sensor.
- A continuous record with the time base checked, because a clock error turns into a height error at mid-tide.
Without the levelling tie, the record is a set of relative water levels. With it, the record connects the sea to the land datum, which is what the hydrographic and topographic surveys both need.
Tide analysis and prediction
The plan's crew for tide analysis was a hydrography engineer at doctoral level, two oceanographers at bachelor level and two data analysts, working on desktop and mobile workstations. That is a strong team for something that is often treated as a by-product of a survey.
Tide analysis takes an observed record and splits it into harmonic constituents: the regular contributions from the moon and the sun, each with its own period, amplitude and phase. The longer the record, the more constituents can be separated reliably. A month of good data resolves the main ones. A longer record separates constituents that are close in period and improves the predictions.
From the constituents come the products that the rest of the project uses:
- Tide predictions for planning and for reducing survey data.
- Tidal levels such as lowest and highest astronomical tide, which define chart datum and design levels.
- The relationship between mean sea level, chart datum and the land vertical datum.
The plan also stated that the hydrographic surveys would use predicted tides supplied by the client. Analysis of a local observed record is how those predictions are checked. In a river delta, where river flow and wind can push water levels away from the astronomical tide, the difference between predicted and observed levels can be significant.
Metocean analysis
Metocean analysis had the largest analysis team in the plan: a hydrography engineer, four oceanographers at bachelor and master level, and two meteorologists. The equipment list was just workstations, because the data comes from instruments deployed under other services, such as the ADCP current meter in the on-call equipment, and from external sources.
Metocean analysis describes the wind, waves, currents and water levels at a site, both as normal conditions and as extremes. For operations, it answers questions such as: how often is the sea calm enough for a diving or lifting operation, and how strong is the current at the pipeline crossing at spring tide. For design, it answers: what is the wave height or current speed with a given return period. The abbreviation list in the plan included return period, highest and lowest astronomical tide, and mean sea level, which says where this work is heading.
The difficulty is that extreme values are, by definition, rare in any short record. Good metocean work combines local measurements with longer regional data and is honest about the uncertainty that remains.
Settlement and deformation monitoring
The second article covered the field side of platform monitoring. In the plan this service sat under data analysis, with a team of geodetic engineers at doctoral and master level and data analysts. That placement makes sense. The field measurements are routine. The hard part is the analysis:
- Adjusting each epoch of measurements as a network, with error estimates.
- Checking that the reference points themselves have not moved.
- Separating real movement from measurement noise.
- Presenting a time series that shows settlement, tilt or deformation clearly enough for a structural engineer to act on.
A single result showing that a leg has moved by a few millimetres means little. A series of results showing a steady trend, with error bars smaller than the trend, is something an engineer can use.
Temporary markers
Setting temporary markers was listed under data analysis, which is a little odd, but the reason is practical. The equipment was wooden stakes for land and plastic buoys or jerrycans of at least 10 litres for water. Markers are how survey results are handed to the people in the field: the dredge crew, the pile crew, the rig move team. A marker in the wrong place is a visible survey error, so setting it out is part of the survey, not an afterthought.
On-call services
The plan also included on-call services, for both equipment and people. The on-call equipment was a WADGNSS positioning system, a dual-frequency singlebeam echo sounder, a precise total station, a processing workstation, a USBL system and an ADCP current meter. The on-call personnel team was an electronics engineer, a surveyor, a surveyor assistant, a data processor and a helper.
This is the "anything else" part of the package. When the client has a small task that does not fit any of the other service lines, such as checking a position, measuring a current, or replacing a failed instrument, the on-call service covers it. The choice of equipment tells you what usually comes up: positioning, depth, a total station for structures, underwater positioning and current measurement.
Quality and risk
The plan's risk table had one line written specifically for this family: tide and metocean instrument inaccuracy, leading to low confidence in results. The mitigation was calibration before deployment and parallel instrument checks. Both are simple and effective. A second gauge or a manual staff reading next to an automatic gauge shows quickly when something has gone wrong. Without it, a slowly drifting sensor can spoil weeks of data before anyone notices.
The other general risks in the plan apply here too: data loss, mitigated by redundant backups and daily transfer, and unclear instructions, mitigated by daily meetings and written approval for any scope change. For analysis work, unclear instructions are a real risk. A tide prediction for planning and a design water level for a structure are different products, and it is worth agreeing at the start which one the client actually needs.
What I took from it
- Short equipment lists can hide senior work. The analysis services had some of the most qualified people in the whole plan.
- A tide gauge is only as useful as its levelling tie. Without it, the record cannot connect sea and land.
- Check predictions against observations. Predicted tides are a model, and deltas do not always follow the model.
- Extremes need long records. Be clear about how much a short measurement campaign can say about rare events.
- Monitoring is about trends, not single numbers. Present results as a series with their uncertainty.
- Agree the product before the analysis. Planning numbers and design numbers answer different questions.